
Bitcoin traders love a clean floor almost as much as they love arguing about whether the floor is real. Right now, the numbers are doing that annoying market thing where two different stories can both sound plausible.
On one side, a power-law model frames a move to $58,000 as a normal cycle low. On the other, futures market data points to the possibility of even lower prices. That is the part we should care about, because it tells us the market is still trying to decide whether this is a routine shakeout or something uglier.
What the $58,000 level actually means
The key detail here is the model, not the headline number by itself. A power-law framework treats Bitcoin’s long-term price action as something that tends to expand and contract within a recurring curve, rather than moving in a straight line.
In plain English, that means $58,000 can be presented as “normal” inside that model even if it feels brutal on a day-to-day chart. That distinction matters. Traders often focus on nearby support and resistance, but long-cycle models try to put price into a broader historical rhythm.
That does not make the number destiny. It just means the model sees a drop to that area as something Bitcoin has room to absorb without breaking its long-term structure.
Why futures data complicates the picture
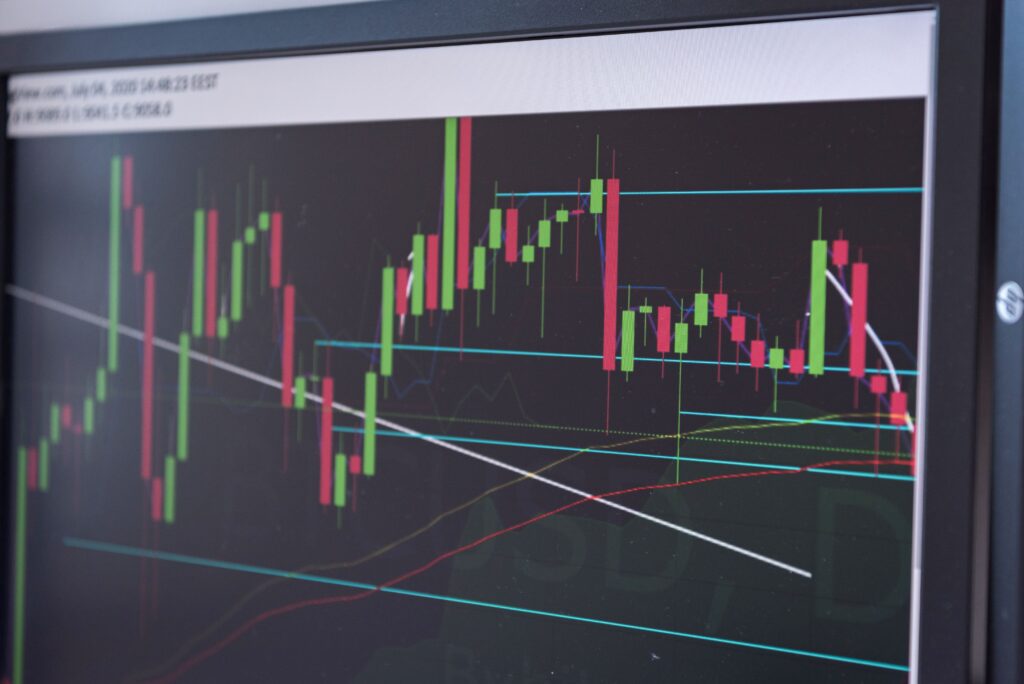
The excerpt also says futures market data points to deeper lows for BTC price. That is the sort of caution flag we should not ignore, because derivatives markets often tell us how aggressively traders are positioned and how much pain can still be forced through the system.
When we say “futures data” we mean specific, measurable things: perpetual swap funding rates, aggregate open interest, the basis between spot and futures, and where concentrated longs or shorts sit on the order books. Those readings can move independently of spot, and they’re the plumbing that turns a wobble into a washout when leverage gets clipped.
When futures positioning leans one way, spot price can look stable right up until it stops being stable. That is why these two signals can coexist:
- The long-term model says a $58,000 low would still fit the cycle.
- Futures data says the market may still have room to flush lower.
That tension is not a contradiction. It is the market doing what it always does, which is making everyone pick a side before the next move makes the argument for us.
How we should read a power-law call in a live market
It helps to treat a model like this as a framework, not a forecast with a guarantee stamp on it. Bitcoin has a long history of making tidy narratives look silly in real time. We’ve seen plenty of cycle theories hold together for a while, then get challenged by leverage, macro pressure, or a sudden change in sentiment.
So the useful question is not, “Does the model say $58,000 is possible?” It clearly does. The better question is whether the surrounding market structure supports that level as a temporary washout or just the first stop on a longer slide. Practically, that means watching whether funding rates normalize, whether open interest unwinds from concentrated longs, and whether spot liquidity holds up when blocks start trading through key levels.
That is where traders will keep arguing over the next few sessions, because both camps have something real to point at. The model has structure. The futures market has positioning. Price gets the last word, as usual, and it rarely says it politely.
A simple way to think about the current setup

| Signal | What it suggests | Why it matters |
|---|---|---|
| Power-law model | $58,000 can count as a normal cycle low | Places the drop inside a longer-term pattern |
| Futures market data | Deeper lows may still be in play | Warns that pressure may not be done yet |
| Spot price behavior | Still the final judge | Can confirm or invalidate both narratives quickly |
What traders are really watching next
For us, the practical takeaway is pretty straightforward. If Bitcoin stabilizes around that zone, the power-law argument will look more convincing. If it breaks lower while futures remain stressed, the market will probably keep testing how much pain traders are willing to take.
Concretely, we’re watching a short list of confirmations: whether funding rates flip and stay benign, whether open interest contracts rather than expands, how spot liquidity behaves around support, and whether options skew or concentrated expiries add an extra shove. Macro events and headline risk can turn any of those signals into an accelerant, so we don’t ignore them either.
Either way, the useful lesson is that a single number does not settle the debate. The market is weighing a long-term model against near-term leverage, and those are not the same thing. That is why this setup matters, even if nobody gets the neat answer they were hoping for.
We will know soon enough which story the chart wants to tell.